Solar Panel Costs in 2026: What You Pay, What You Get Back, and When
Published: June 19, 2026Updated: June 30, 2026Read Time: 10 min readBy Mauricio L.
Share:
Link Copied!Ready to share.
Avg. System Cost (Before ITC)$18,000-$25,000
After 30% Federal ITC~$12,600-$17,500
Avg. Payback Period6-9 Years
Panel Lifespan25-30 Years
Highlights
[ NOTE // 01 ]
A typical 6–8 kW residential solar system costs $18,000–$25,000 before incentives. The federal Investment Tax Credit (ITC) covers 30% of system cost, bringing the net range to roughly $12,600–$17,500 for most households. National average payback is 6–9 years, but the actual figure depends heavily on local electricity rates, sun exposure, and your utility's net metering policy.
Solar's financial case is straightforward in principle: you pay a large sum upfront, you stop paying (or pay less) for electricity over the next 25 years, and at some point in the middle, the savings exceed the cost. The complication is that everything past the upfront number, how much you save, how fast you break even, what the panels are worth when you sell, depends on variables specific to your house, your utility, and your state.
This article works through those variables so you can run the actual math for your situation, not a national average that may not apply to you.
Summary
A 6–8 kW system runs $18,000–$25,000 installed. After the 30% federal ITC, your net cost is roughly $12,600–$17,500. National average payback is 6–9 years (you can estimate your specific timeline with our solar savings calculator or read our guide on the solar payback period). The homes where solar pays back fastest share three traits: high local electricity rates, strong sun exposure with minimal roof shading, and a utility that offers full retail net metering. Any one of those missing significantly extends the payback window.
Cost ranges per EnergySage 2026 Solar Market Trends Report. Tax credit per IRS Residential Clean Energy Credit (Form 5695).
What this article covers:
How to calculate your actual payback period with your local rates
What net metering is and why it matters more than the panel brand
The three roof and home conditions that disqualify solar financially
Leasing vs. buying: what you give up with a $0-down lease
Breaking Down the Actual Cost
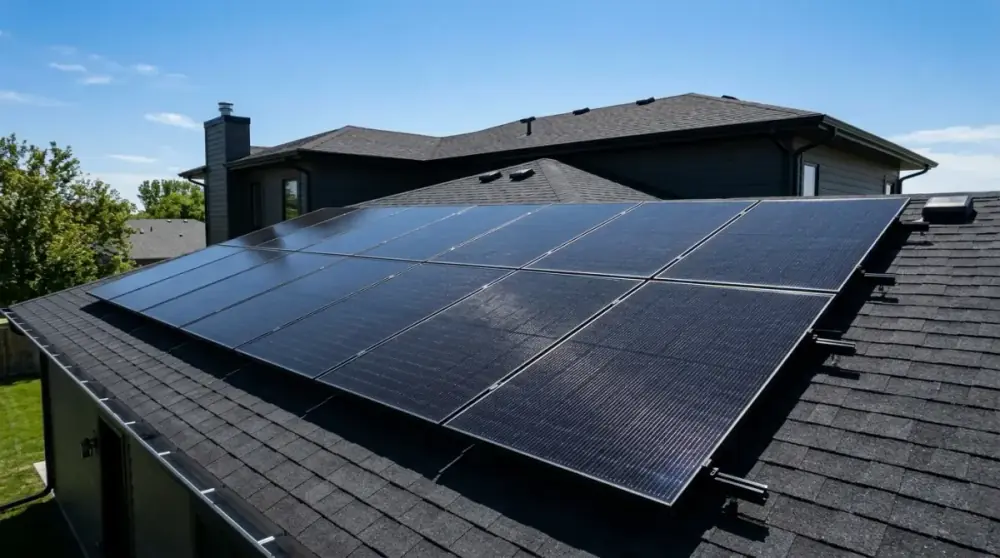
The $18,000–$25,000 range covers the full installed cost of a typical 6–8 kW system: panels, inverter, racking hardware, wiring, permits, and labor. Larger homes with higher electricity use may need a 10–12 kW system, pushing toward the upper end.
System Size (DC)
Est. Panels (400W)
Avg. Gross Cost
30% Federal ITC
Net Installed Cost
6 kW
15 Panels
$16,800
-$5,040
$11,760
*8 kW*
20 Panels
$22,400
-$6,720
$15,680
10 kW
25 Panels
$28,000
-$8,400
$19,600
12 kW
30 Panels
$33,600
-$10,080
$23,520
The federal Investment Tax Credit (ITC) reduces your tax liability by 30% of the total installed cost in the year you activate the system. On a $22,000 system, that's $6,600 off your federal taxes. This is a credit against what you owe, not a refund, so you need sufficient tax liability to use it. Any unused portion carries forward to subsequent tax years.
State and utility incentives vary significantly. Some states offer additional rebates, property tax exemptions for the added home value, or sales tax exemptions on equipment. The DSIRE database (dsireusa.org) maintains a current list of programs by state. Local utility rebates are worth checking separately: some offer $500–$2,000 for new solar installations.
Calculating Your Payback Period
The payback calculation has three inputs: your net system cost after incentives, your annual electricity production in kilowatt-hours, and your local electricity rate.
Example: Net system cost of $15,000. System produces 9,000 kWh per year. Local rate is $0.22/kWh. Annual savings: 9,000 × $0.22 = $1,980. Payback: $15,000 ÷ $1,980 = 7.6 years.
Change the electricity rate to $0.12/kWh and the same system produces $1,080 in annual savings, a 13.9-year payback on the same hardware. That's why electricity rate matters more than panel brand, system size, or installer when evaluating whether solar makes sense for your home.
Net Metering: Why Your Utility's Policy Matters
Most solar systems produce more electricity than the home uses during daylight hours and less at night. Net metering determines what happens to that surplus.
Under full retail net metering, your utility credits your account at the same rate you'd pay to buy electricity, typically $0.15–$0.30/kWh depending on your state. That credit offsets what you draw at night. Your effective savings rate per kWh produced equals your retail rate.
Some utilities have moved to avoided-cost net metering, crediting excess power at wholesale rates, sometimes $0.03–$0.06/kWh. That dramatically changes the math. A system that would pay back in 7 years under retail net metering might take 14–18 years under avoided-cost rates.
Check your utility's current net metering policy before signing a solar contract. Policies are actively changing in many states. The DSIRE database tracks current net metering rules by state and utility.
Three Situations Where Solar Doesn't Make Financial Sense
Significant roof shading. Mature trees, neighboring buildings, or rooftop obstructions that shade panels during peak hours reduce production substantially. A shading analysis from your installer will show this, ask for it. If more than 20% of the roof area is shaded during prime generation hours, the production estimates will be optimistic and payback will run longer than projected.
A roof that needs replacement soon. Removing and reinstalling panels for a roof replacement costs $3,000–$7,000 in additional labor. If your current roof has fewer than 10 years of service life remaining, replacing it before solar installation is the correct sequence. Adding panels to a roof you'll need to replace in three years doubles your disruption cost.
Planning to sell within five years. While the Lawrence Berkeley National Laboratory found that solar does add to home value in most studied markets, buyers don't always pay full system value, and a solar lease or PPA attached to the property can complicate a sale. Buyers must qualify to assume the contract, and not all will. If you're not staying long enough to approach the payback period, the financial case for solar weakens considerably.
Leasing vs. Buying: What You Give Up
Solar leases and Power Purchase Agreements (PPAs) offer low or no upfront cost. In exchange, a third party owns the system, you don't claim the federal tax credit, and you agree to a 20–25 year contract with the solar company.
When you sell the house, the buyer must qualify to assume the lease or PPA. This can delay closings or cause deals to fall through. Some buyers specifically filter out homes with solar leases attached.
A solar loan, where you own the system and carry the financing, avoids those complications. You claim the ITC, build equity in the asset, and the system transfers cleanly with the property at sale. The interest cost of the loan reduces your net savings, but for most homeowners who plan to stay long-term, ownership is the better financial structure.
Use our Solar Payback Calculator to plug in your electricity rate, system size, and local incentives to estimate your actual break-even timeline.
Frequently Asked Questions
How does the 30% federal tax credit work?▼
The federal Residential Clean Energy Credit (ITC) lets you deduct 30% of your solar system's total installed cost from your federal income taxes. On a $20,000 system, that's a $6,000 reduction in what you owe, not a refund. If your tax liability is less than the credit amount in the installation year, the remaining credit carries forward to future tax years. Verify current eligibility with a tax professional, as income and system requirements apply.
What happens after the payback period?▼
Once your cumulative energy savings equal your net system cost, the panels continue producing for their remaining service life, typically 15–20 more years. During that period, the savings represent electricity you're not buying from the utility. The actual value of those savings depends on what electricity rates do over time.
Does solar increase home resale value?▼
Research by the Lawrence Berkeley National Laboratory (LBNL) found that buyers paid a premium for homes with solar in studied markets, averaging roughly $4 per watt of installed capacity, meaning a 6 kW system added about $24,000 to sale price in those markets. Results vary significantly by region, electricity rates, and whether the system is owned outright or under a lease or PPA (see also our general guide on how <a href='/articles/renovations-add-resale-value/' class='text-[var(--accent)] hover:underline font-semibold'>renovations add resale value</a>).
§
Research Citations & Verified Authorities
EEAT Compliant
To maintain absolute calculation integrity and trust, the structural lifespans, standard sizes, and pricing models in this guide are gathered from governing construction authorities and verified trade standards.
Database of State Incentives for Renewables & Efficiency (DSIRE)Audit Source →
EnergySage Solar Marketplace - 2026 Solar Market Trends ReportAudit Source →
IRS - Residential Clean Energy Credit (Form 5695)Audit Source →
Mauricio L.
// Creator of Meazora
Mauricio L. is a software developer who loves working with his hands. He built Meazora because he was tired of online calculators that exist just to capture your email and phone number. Every calculator here runs completely in your browser to keep your planning private, fast, and simple.